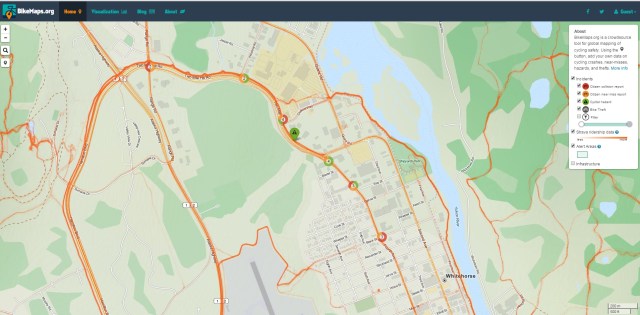
If you are a member of the WUCC facebook group, you may have already seen this nifty site. However, if you haven’t, now is a great time to check it out. As stated on their website, BikeMaps.org is a crowdsource tool for global mapping of cycling safety. When you zoom in on Whitehorse, it looks something like this:
The purpose behind this website is to map people’s cycling experience in order to make biking safer. Since you know your local cycling trouble spots better than anyone else, you provide the data. By allowing citizens to map cycling collisions and near misses, and to identify the location of hazards and thefts, the project aims to collect comprehensive data to facilitate better research into cycling safety.
All reports are anonymous. Citizen mappers identify the location of their cycling incident by clicking a “submit new point” button and adding the location on the map where the incident occurred. They then report details of collisions and near misses on a digital form through pull-down options. The attributes captured through the pull-down menus are designed to enable research on important determinants of cycling injury.
You can read more about the BikeMaps.org project in this article in the journal Frontiers in Public Health.
So, let’s build the data for Whitehorse! We can provide the evidence needed to help governments and decision makers improve road safety for riders.


